Market Outlook
October 06, 2017
Market Cues
Domestic Indices
Chg (%)
(Pts)
(Close)
Indian markets are likely to open in flat tracking global indices and SGX Nifty.
BSE Sensex
(0.3)
(80)
31,592
Nifty
(0.3)
(26)
9,889
U.S. stocks hit record highs Thursday as the S&P 500 completed its longest winning
streak in four years. The broad index gained 0.6 percent to 2,552.07, notching
Mid Cap
0.5
77
15,692
intraday and closing records. It was also posted an eight-day winning streak, its
Small Cap
0.8
129
16,449
longest since 2013. The S&P 500 also had its sixth straight record close, the longest
Bankex
(0.3)
(84)
27,043
such streak since 1997.
Global Indices
Chg (%)
(Pts)
(Close)
The majority of the European markets ended Thursday's session with modest gains.
However, after being stuck in a sideways pattern throughout the day, the markets
Dow Jones
0.5
114
22,775
finished little changed overall. Traders were in a cautious mood as they continue to
Nasdaq
0.8
51
6,585
monitor the developments in Spain, following Catalonia's independence vote.
FTSE
0.5
40
7,508
Investors are also awaiting the release of the U.S. jobs report for September on
Nikkei
0.0
2
20,629
Friday
Hang Seng
0.7
206
28,379
Indian Markets gave up early gains to end lower on Thursday, snapping a four-day
Shanghai Com
0.3
9
3,349
winning streak. The downside, however, remained limited after survey figures form
IHS Markit showed India's service sector activity recovered from the GST-related
Advances / Declines
BSE
NSE
contractions registered in the previous two months.
Advances
1,505
935
News Analysis
Declines
1,166
736
Natco pharma - Copaxone update
Unchanged
106
95
Detailed analysis is on Pg2
Volumes (` Cr)
Investor’s Ready Reckoner
BSE
3,348
Key Domestic & Global Indicator
NSE
25,106
Stock Watch: Latest investment recommendations on 150+ stocks
Refer Pg7 onwards
#Net Inflows (` Cr)
Net
Mtd
Ytd
FII
(511)
(948)
35,58
Top Picks
CMP
Target
Upside
MFs
1,384
1,384
87,72
Company
Sector
Rating
(`)
(`)
(%)
Blue Star
Capital Goods Accumulate
780
850
9.0
Top Gainer
Price (`)
Chg (%)
Dewan Housing FinanceFinancials
Accumulate
558
610
9.3
Asian Granito
Other
Buy
473
570
20.6
Icil
109
10.2
Navkar Corporation
Other
Buy
185
265
43.5
Dbl
683
9.0
KEI Industries
Capital Goods
Accumulate
356
380
6.8
Gnfc
369
7.8
More Top Picks on Pg5
Justdial
393
7.1
Key Upcoming Events
Intellect
127
5.9
Previous
Consensus
Date
Region
Event Description
Reading
Expectations
Oct06, 2017 US
Change in Nonfarm payrolls
156.00
80.00
Top Loser
Price (`)
Chg (%)
Oct06, 2017 India
Imports YoY%
21.00
Videoind
15
(4.8)
Oct10, 2017 US
Unnemployment rate
4.40
4.40
Infratel
404
(3.1)
Oct10, 2017 India
Exports YoY%
10.30
Techm
451
(2.9)
Oct10, 2017 India
Industrial Production YoY
1.20
More Events on Pg7
Suzlon
15
(2.9)
Sjvn
33
(2.7)
#as on 05th Oct, 2017
Market Outlook
October 06, 2017
News Analysis
Natco pharma - Copaxone update
The launch of Generic Copaxone (Glatiramer Acetate), multiple sclerosis drug, in
the US market is very positive news. While there is an existing generic player in the
20mg (Momenta/Sandoz - Glatopa-20mg), there is no competition in 40mg
hence we believe that Mylan/Natco’s gCopaxone-40mg is the only generic in 40
mg strength. The approval to Momenta/Sandoz’s Glatopa-40 mg is likely to delay
due to the existing warning letter on their manufacturing facility. We expect Natco
to book profit of $80mn in FY18 and $180mn profit in FY19 assuming lower price
erosion and 3-4 competitors. The stock has seen a steep run-up upon the
approval which leaves less room for the upside. We maintain Accumulate rating
with a price target of `1,057.
Economic and Political News
Measures to ease traders' GST to be announced soon
| RBI should help govt restart stalled projects that need funding: Goyal
Housing sales fall 35% in 8 cities; supply dips 83%: PropEquity
Wind power tariff plunges to record low of `2.64 per unit
Corporate News
IDFC-Shriram merger deadline extended to Nov 8
RCom's Aircel merger plan failure credit negative: Moody's
Wipro buys US-based consultancy firm Cooper for $8.5 million
Market Outlook
October 06, 2017
Top Picks
Market Cap
CMP
Target
Upside
Company
Rationale
(` Cr)
(`)
(`)
(%)
Strong growth in domestic business due to its leade`hip
in acute therapeutic segment. Alkem expects to launch
Alkem Laboratories
21,901
1,832
2,079
13.5
more products in USA, which bodes for its international
business.
We expect the company would report strong profitability
Asian Granito
1,422
473
570
20.6
owing to better product mix, higher B2C sales and
amalgamation synergy.
Favorable outlook for the AC industry to augur well for
Cooling products business which is out pacing the
Blue Star
7,469
780
850
9.0
market growth. EMPPAC division's profitability to
improve once operating environment turns around.
With a focus on the low and medium income (LMI)
consumer segment, the company has increased its
Dewan Housing Finance
17,499
558
610
9.3
presence in tier-II & III cities where the growth
opportunity is immense.
Loan growth is likely to pick up after a sluggish FY17.
Lower credit cost will help in strong bottom-line growth.
Karur Vysya Bank
8,666
143
180
25.5
Increasing share of CASA will help in NIM
improvement.
High order book execution in EPC segment, rising B2C
KEI Industries
2,767
356
380
6.8
sales and higher exports to boost the revenues and
profitability
Expected to benefit from the lower capex requirement
Music Broadcast
2,177
382
434
13.7
and 15 year long radio broadcast licensing.
Massive capacity expansion along with rail advantage
Navkar Corporation
2,633
185
265
43.5
at ICD as well CFS augur well for the company
Strong brands and distribution network would boost
Siyaram Silk Mills
2,198
2,345
2,500
6.6
growth going ahead. Stock currently trades at an
inexpensive valuation.
Market leaderhip in Hindi news genre and no.
2
viewe`hip ranking in English news genre, exit from the
TV Today Network
2,169
364
435
19.6
radio business, and anticipated growth in ad spends by
corporates to benefit the stock.
After GST, the company is expected to see higher
volumes along with improving product mix. The Gujarat
Maruti Suzuki
2,36,782
7,838
8,658
10.5
plant will also enable higher operating leverage which
will be margin accretive.
We expect loan book to grow at 24.3% over next two
GIC Housing
2,746
510
655
28.4
year; change in borrowing mix will help in NIM
improvement..
Source: Company, Angel Research
Market Outlook
October 06, 2017
Key Upcoming Events
Global economic events release calendar
Bloomberg Data
Date
Time
Country
Event Description
Unit
Period
Last Reported
Estimated
Oct 06, 2017
6:00 PMUS
Change in Nonfarm payrolls
Thousands
Sep
156.00
80.00
India
Imports YoY%
% Change
Sep
21.00
Oct 10, 2017
6:00 PMUS
Unnemployment rate
%
Sep
4.40
4.40
India
Exports YoY%
% Change
Sep
10.30
5:30 PMIndia
Industrial Production YoY
% Change
Aug
1.20
Oct 12, 2017
2:00 PMUK
Industrial Production (YoY)
% Change
Aug
0.40
US
Producer Price Index (mom)
% Change
Sep
0.50
Oct 13, 2017
6:00 PMUS
Consumer price index (mom)
% Change
Sep
0.40
0.60
China
Exports YoY%
% Change
Sep
5.60
9.50
Oct 16, 2017
12:00 PMIndia
Monthly Wholesale Prices YoY%
% Change
Sep
3.24
7:00 AMChina
Consumer Price Index (YoY)
% Change
Sep
1.80
1.60
Oct 17, 2017
2:30 PMEuro Zone
Euro-Zone CPI (YoY)
%
Sep F
1.50
6:45 PMUS
Industrial Production
%
Sep
(0.90)
(0.10)
2:00 PMUK
CPI (YoY)
% Change
Sep
2.90
Oct 18, 2017
6:00 PMUS
Housing Starts
Thousands
Sep
1,180.00
1,200.00
6:00 PMUS
Building permits
Thousands
Sep
1,272.00
1,260.00
7:30 AMChina
Industrial Production (YoY)
% Change
Sep
6.00
Oct 19, 2017
2:00 PMUK
Jobless claims change
% Change
Sep
(2.80)
7:30 AMChina
Real GDP (YoY)
% Change
3Q
6.90
Oct 20, 2017
7:30 PMUS
Existing home sales
Million
Sep
5.35
5.36
Oct 23, 2017
7:30 PMEuro Zone
Euro-Zone Consumer Confidence
Value
Oct A
(1.20)
Oct 24, 2017
1:00 PMGermany
PMI Manufacturing
Value
Oct P
60.60
1:00 PMGermany
PMI Services
Value
Oct P
55.60
Oct 25, 2017
2:00 PMUK
GDP (YoY)
% Change
3Q A
1.50
Source: Bloomberg, Angel Research
Market Outlook
October 06, 2017
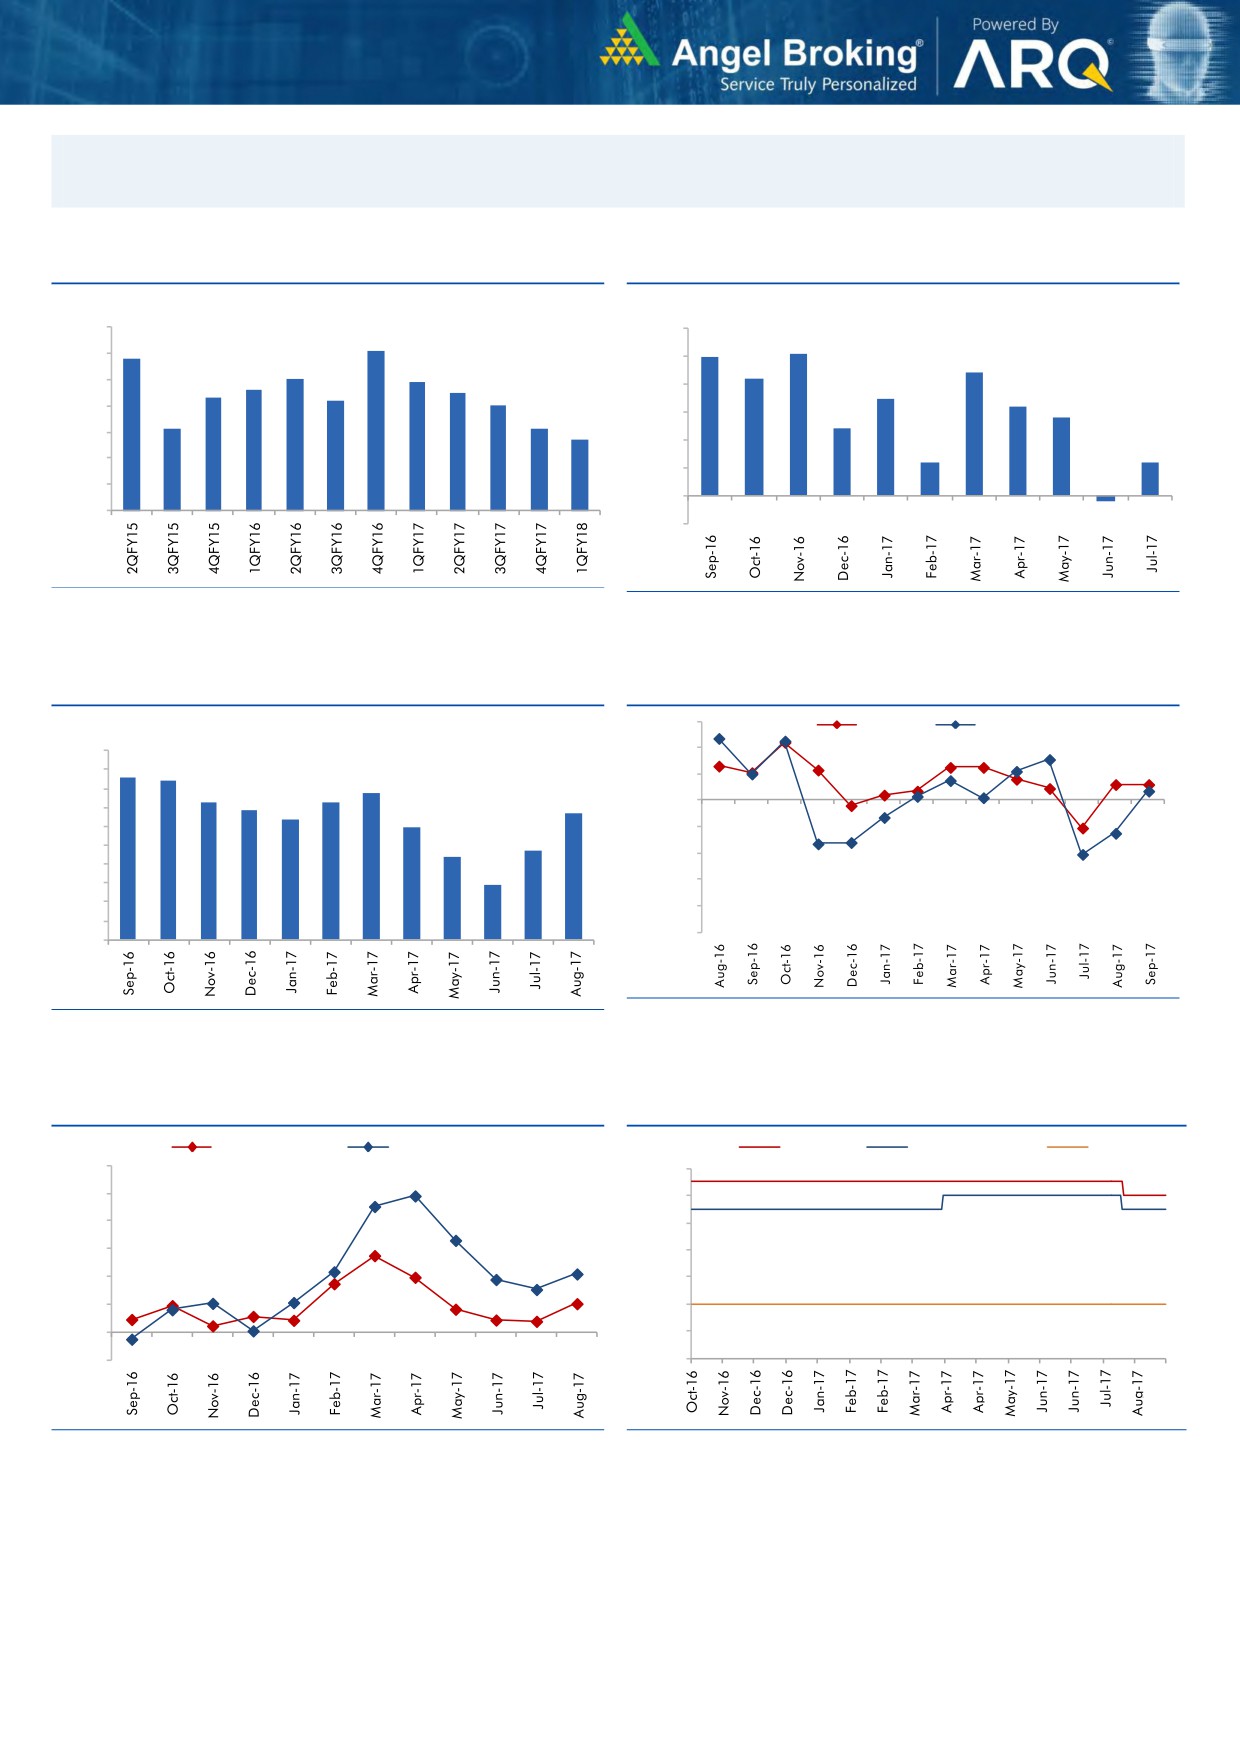
Macro watch
Exhibit 1: Quarterly GDP trends
Exhibit 2: IIP trends
(%)
(%)
10.0
6.0
9.1
5.1
8.8
5.0
9.0
5.0
4.4
8.0
7.9
4.2
7.6
7.5
8.0
7.3
7.2
4.0
3.5
7.0
3.2
2.8
7.0
6.1
6.1
3.0
2.4
5.7
6.0
2.0
1.2
1.2
5.0
1.0
4.0
-
3.0
(1.0)
(0.2)
Source: CSO, Angel Research
Source: MOSPI, Angel Research
Exhibit 3: Monthly CPI inflation trends
Exhibit 4: Manufacturing and services PMI
56.0
Mfg. PMI
Services PMI
(%)
5.0
54.0
4.3
4.2
4.5
3.9
52.0
4.0
3.6
3.7
3.4
3.4
3.2
50.0
3.5
3.0
3.0
48.0
2.4
2.2
2.5
46.0
2.0
1.5
1.5
44.0
1.0
42.0
0.5
40.0
-
Source: Market, Angel Research; Note: Level above 50 indicates expansion
Source: MOSPI, Angel Research
Exhibit 5: Exports and imports growth trends
Exhibit 6: Key policy rates
(%)
Exports yoy growth
Imports yoy growth
(%)
Repo rate
Reverse Repo rate
CRR
60.0
6.50
50.0
6.00
40.0
5.50
30.0
5.00
20.0
4.50
10.0
4.00
0.0
3.50
(10.0)
3.00
Source: Bloomberg, Angel Research
Source: RBI, Angel Research
Market Outlook
October 06, 2017
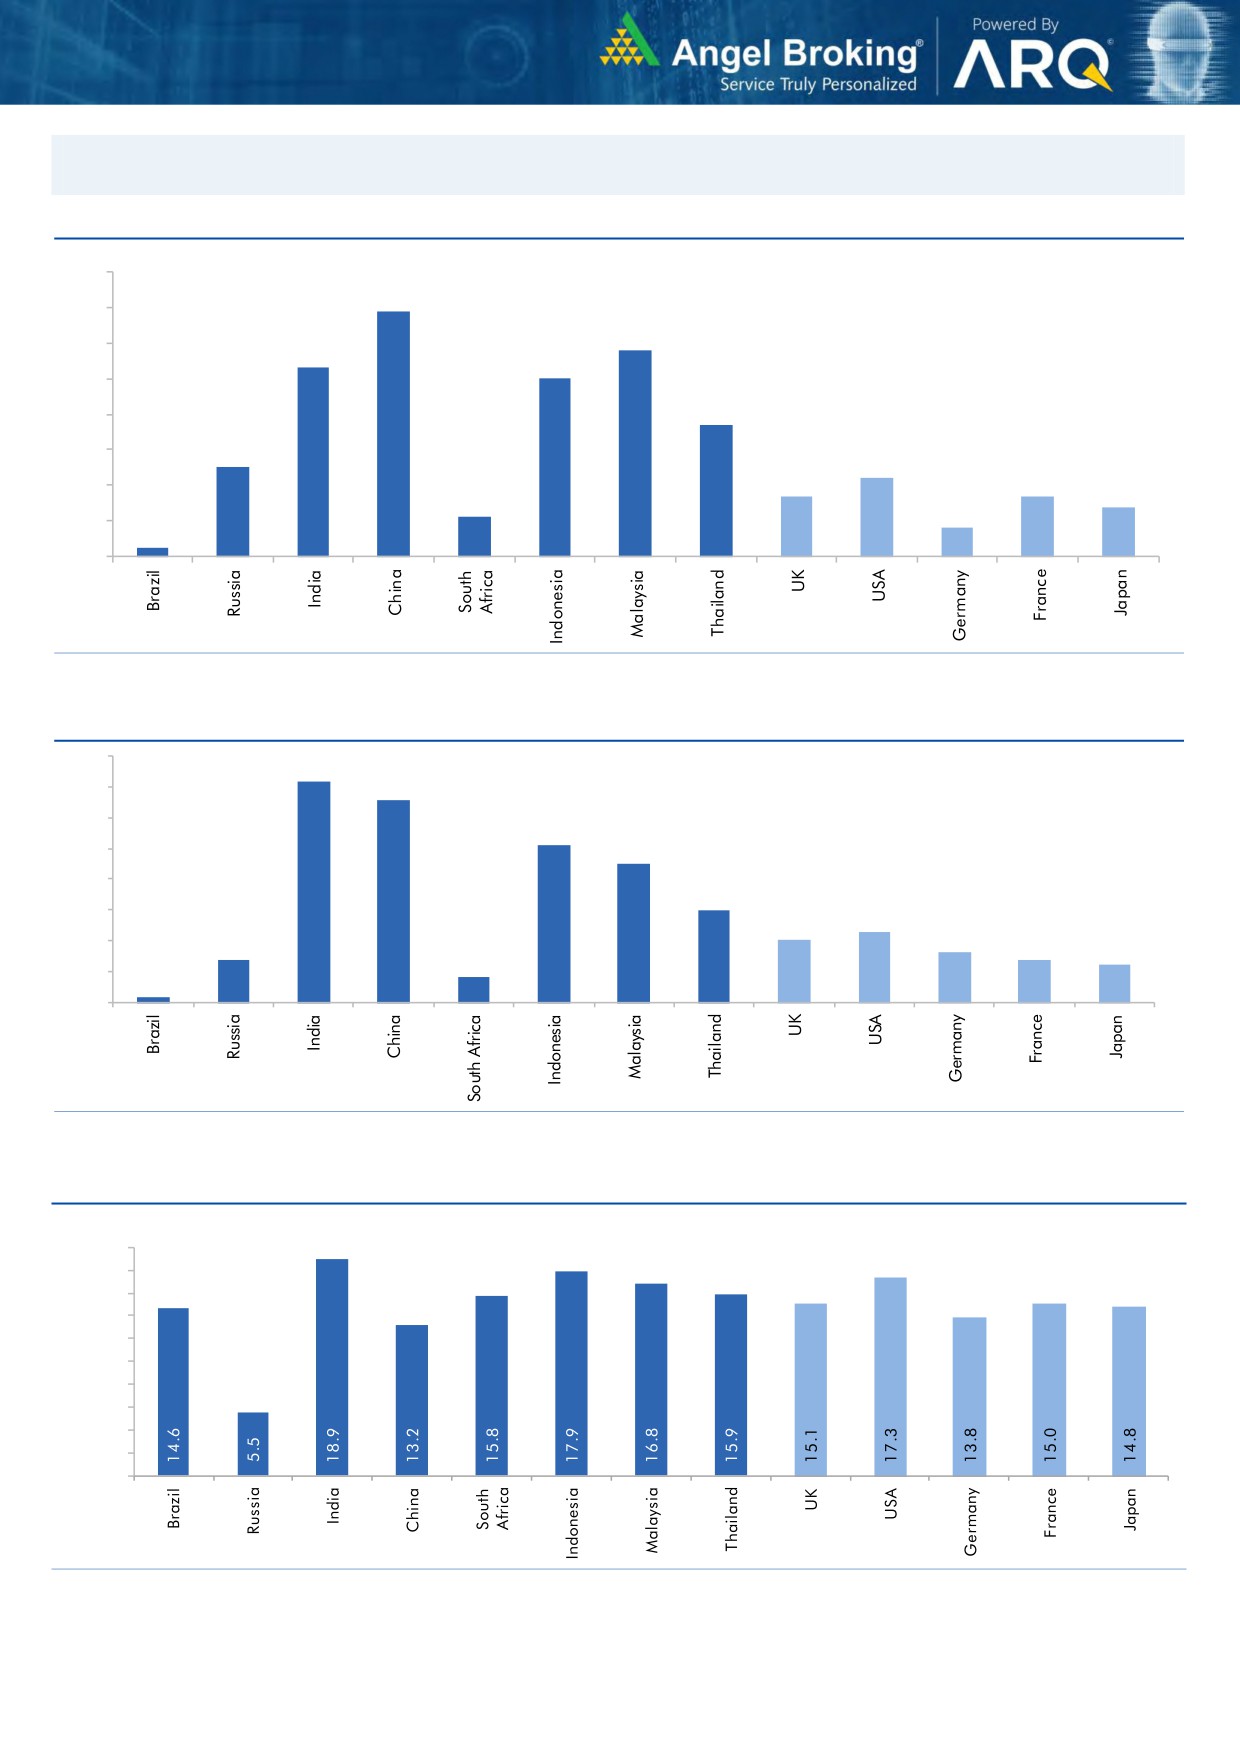
Global watch
Exhibit 1: Latest quarterly GDP Growth (%, yoy) across select developing and developed countries
(%)
8.0
6.9
7.0
5.8
6.0
5.3
5.0
5.0
1.1
3.7
4.0
2.5
3.0
2.2
1.7
1.7
2.0
1.4
0.8
1.0
0.3
-
Source: Bloomberg, Angel Research
Exhibit 2: 2017 GDP Growth projection by IMF (%, yoy) across select developing and developed countries
(%)
7.2
6.6
7.0
6.0
5.1
5.0
4.5
4.0
3.0
3.0
2.3
2.0
1.4
1.6
2.0
1.4
1.2
0.2
0.8
1.0
-
Source: IMF, Angel Research
Exhibit 3: One year forward P-E ratio across select developing and developed countries
(x)
20.0
18.0
16.0
14.0
12.0
10.0
8.0
6.0
4.0
2.0
-
Source: IMF, Angel Research, data as of 05th Oct-17
Market Outlook
October 06, 2017
Exhibit 4: Relative performance of indices across globe
Returns (%)
Country
Name of index
Closing price
1M
3M
1YR
Brazil
Bovespa
76,618
6.2
22.6
28.9
Russia
Micex
2,088
4.2
9.2
5.5
India
Nifty
9,889
(0.2)
2.9
14.8
China
Shanghai Composite
3,349
(0.4)
4.8
10.7
South Africa
Top 40
50,786
2.0
9.8
12.6
Mexico
Mexbol
50,481
0.4
0.8
6.1
Indonesia
LQ45
983
1.5
0.6
7.0
Malaysia
KLCI
1,759
(0.8)
(0.5)
5.7
Thailand
SET 50
1,078
4.3
8.3
13.5
USA
Dow Jones
22,775
4.7
6.8
24.7
UK
FTSE
7,508
1.8
2.3
6.6
Japan
Nikkei
20,629
5.7
3.0
23.6
Germany
DAX
12,968
7.2
4.7
22.6
France
CAC
5,379
5.8
4.5
22.1
Source: Bloomberg, Angel Research, data as of 05th Oct-17 p68in4
Stock Watch
October 06, 2017
Company Name
Reco
CMP
Target
Mkt Cap
Sales ( Čcr )
OPM(%)
EPS (Č)
PER(x)
P/BV(x)
RoE(%)
EV/Sales(x)
(Č)
Price ( Č)
( Č cr )
FY18E FY19E
FY18E
FY19E
FY18E
FY19E
FY18E
FY19E
FY18E
FY19E
FY18E
FY19E
FY18E
FY19E
Agri / Agri Chemical
Rallis
Neutral
214
-
4,155
1,873
2,099
15.0
15.0
9.5
10.5
22.5
20.4
3.4
3.1
15.8
16.0
2.1
1.9
United Phosphorus
Neutral
785
-
39,876
18,922
21,949
18.0
18.5
36.2
45.6
21.7
17.2
4.5
3.7
22.7
23.8
2.3
1.9
Auto & Auto Ancillary
Ashok Leyland
Neutral
123
-
35,865
23,339
27,240
10.1
10.8
4.7
6.2
26.4
19.7
5.3
4.6
20.0
23.6
1.5
1.3
Bajaj Auto
Neutral
3,131
-
90,595
23,936
27,955
19.5
20.1
142.7
167.3
21.9
18.7
4.8
4.3
21.8
22.8
3.4
2.8
Bharat Forge
Buy
632
875
29,439
7,637
8,755
21.7
23.2
36.1
47.3
17.5
13.4
3.1
2.7
18.5
20.8
3.7
3.2
Eicher Motors
Neutral
30,789
-
83,815
19,043
22,837
19.5
19.9
835.4
1,019.0
36.9
30.2
13.8
10.6
40.9
37.8
4.3
3.5
Gabriel India
Neutral
196
-
2,815
1,782
2,033
9.7
10.2
7.1
8.9
27.6
22.2
5.6
4.7
21.0
22.2
1.5
1.3
Hero Motocorp
Accumulate
3,757
4,129
75,030
32,239
36,878
16.0
15.6
184.4
206.5
20.4
18.2
6.4
5.6
31.3
30.7
2.1
1.8
Jamna Auto Industries Neutral
55
-
2,193
1,441
1,662
14.4
14.8
13.9
17.6
4.0
3.1
1.1
0.9
30.0
31.0
1.5
1.3
Mahindra and Mahindra Neutral
1,301
-
80,779
46,971
53,816
13.6
14.0
67.7
79.8
19.2
16.3
2.7
2.5
15.0
15.9
1.6
1.4
Maruti
Accumulate
7,838
8,658
236,782
81,825
101,245
15.0
15.0
283.5
356.0
27.7
22.0
6.0
4.9
21.9
22.4
2.6
2.0
Minda Industries
Neutral
863
-
7,461
4,328
5,084
11.0
11.9
27.3
36.4
31.7
23.7
6.7
5.3
23.1
25.6
1.8
1.5
Motherson Sumi
Neutral
336
-
70,807
55,937
64,445
10.8
11.4
16.9
21.1
19.9
16.0
4.5
4.5
25.2
25.4
1.3
1.1
Tata Motors
Neutral
423
-
122,178
303,167
343,649
11.8
13.8
33.1
54.7
12.8
7.7
2.1
1.7
16.9
23.0
0.5
0.4
TVS Motor
Neutral
655
-
31,121
13,992
16,216
9.0
9.4
17.1
20.3
38.4
32.3
10.2
7.9
29.7
27.7
2.2
1.8
Amara Raja Batteries
Buy
705
858
12,042
6,140
7,122
14.3
15.6
29.3
39.0
24.1
18.1
4.1
3.4
17.1
19.0
2.0
1.7
Exide Industries
Neutral
204
-
17,349
8,689
9,854
15.1
15.2
9.7
11.0
21.2
18.6
3.8
3.3
15.7
16.1
1.7
1.5
Apollo Tyres
Neutral
239
-
12,189
15,739
17,326
13.3
14.6
20.4
26.7
11.7
9.0
1.4
1.3
20.4
26.7
1.0
0.9
Ceat
Neutral
1,718
-
6,948
6,661
7,717
11.1
14.2
116.2
178.2
14.8
9.6
2.6
2.1
15.2
21.3
1.2
1.0
JK Tyres
Neutral
148
-
3,367
8,318
9,239
16.2
16.4
21.0
27.5
7.1
5.4
1.4
1.1
19.1
20.4
0.9
0.7
Swaraj Engines
Neutral
2,015
-
2,502
788
889
16.4
16.5
71.6
81.0
28.1
24.9
8.1
7.5
29.6
31.0
2.8
2.5
Subros
Neutral
239
-
1,436
1,855
2,135
11.6
11.8
10.3
14.7
23.4
16.3
3.6
3.0
15.8
19.1
1.0
0.8
Capital Goods
BEML
Neutral
1,727
-
7,191
4,286
5,194
7.1
8.2
42.9
58.1
40.3
29.7
3.3
3.0
7.6
8.7
1.7
1.4
Bharat Electronics
Neutral
164
-
40,233
10,258
12,470
19.6
19.5
7.3
8.6
22.4
19.0
0.4
0.4
20.4
21.9
3.4
2.8
Voltas
Neutral
518
-
17,155
6,778
8,004
9.6
11.0
17.1
22.4
30.3
23.2
7.2
6.3
17.7
19.8
2.2
1.9
BHEL
Neutral
84
-
30,711
33,200
39,167
6.8
9.5
6.2
11.2
13.5
7.5
0.6
0.6
4.6
8.0
0.5
0.4
Blue Star
Accumulate
780
850
7,469
5,220
6,207
6.3
6.6
16.8
22.3
46.4
35.0
9.2
8.2
19.9
23.3
1.4
1.2
CG Power and Industrial
Neutral
80
-
5,039
6,555
7,292
7.5
7.5
-
0.8
8,040.0
100.5
1.3
1.3
0.1
1.2
0.9
0.8
Solutions
Greaves Cotton
Neutral
135
-
3,291
1,778
1,993
14.7
15.1
8.1
9.1
16.6
14.8
3.7
3.5
21.8
23.6
1.6
1.4
Stock Watch
October 06, 2017
Company Name
Reco
CMP
Target
Mkt Cap
Sales ( Čcr )
OPM(%)
EPS (Č)
PER(x)
P/BV(x)
RoE(%)
EV/Sales(x)
(Č)
Price ( Č)
( Č cr )
FY18E FY19E
FY18E
FY19E
FY18E
FY19E
FY18E
FY19E
FY18E
FY19E
FY18E
FY19E
FY18E
FY19E
Capital Goods
KEC International
Accumulate
311
350
7,989
9,779
11,113
9.4
9.8
14.2
18.2
21.9
17.1
4.2
3.4
21.1
22.1
1.1
0.9
KEI Industries
Accumulate
356
380
2,767
3,001
3,391
10.0
10.0
13.0
16.1
27.3
22.1
5.0
4.1
18.2
18.7
1.1
1.0
Thermax
Neutral
920
-
10,961
4,125
4,747
10.3
10.8
26.7
31.5
34.5
29.2
3.9
3.5
11.2
12.0
2.4
2.1
VATech Wabag
Buy
585
681
3,195
3,867
4,126
9.6
10.0
34.9
39.8
16.8
14.7
2.8
2.4
17.7
17.5
0.8
0.8
Cement
ACC
Neutral
1,702
-
31,955
12,255
13,350
13.5
14.3
58.0
66.2
29.3
25.7
3.5
3.2
11.5
12.2
2.6
2.4
Ambuja Cements
Neutral
274
-
54,456
10,250
11,450
17.5
19.0
7.2
8.3
38.1
33.0
2.7
2.6
7.0
7.8
5.1
4.5
India Cements
Neutral
182
-
5,618
6,135
6,750
14.8
15.2
8.5
11.5
21.5
15.9
1.1
1.0
4.8
6.2
1.3
1.1
JK Cement
Neutral
980
-
6,850
4,150
4,775
19.2
20.0
49.0
63.5
20.0
15.4
3.2
2.7
17.0
18.5
2.1
1.8
J K Lakshmi Cement
Neutral
393
-
4,626
3,422
3,757
15.5
17.0
13.5
23.2
29.1
16.9
3.0
2.6
10.8
15.5
1.8
1.5
Orient Cement
Neutral
155
-
3,169
2,215
3,233
16.8
17.0
5.9
6.9
26.2
22.4
2.0
1.9
10.8
10.1
2.4
1.6
UltraTech Cement
Neutral
3,897
-
106,991
28,250
35,150
20.2
23.5
77.5
122.2
50.3
31.9
4.2
3.8
9.6
14.8
4.3
3.4
Construction
KNR Constructions
Neutral
204
-
2,869
1,846
2,203
14.5
14.5
12.1
13.7
16.9
15.0
0.9
0.8
17.5
16.7
1.6
1.3
Larsen & Toubro
Neutral
1,132
-
158,556
95,787
109,476
10.2
11.6
44.5
50.8
25.5
22.3
3.2
2.9
12.9
13.1
2.2
2.0
Gujarat Pipavav Port
Neutral
141
-
6,826
739
842
61.6
62.7
5.1
6.2
27.7
23.0
3.5
3.4
12.7
14.9
8.7
7.5
PNC Infratech
Neutral
148
-
3,784
2,040
2,935
13.0
13.0
6.4
9.0
23.1
16.4
0.6
0.5
9.7
12.2
1.9
1.3
Simplex Infra
Neutral
481
-
2,380
6,012
6,619
11.6
11.7
21.1
31.0
22.9
15.5
1.6
1.5
6.5
8.6
0.9
0.8
Sadbhav Engineering
Neutral
290
-
4,967
3,823
4,426
10.7
10.8
10.3
11.8
28.1
24.5
3.4
3.0
10.1
10.5
1.6
1.4
NBCC
Neutral
215
-
19,346
9,099
12,706
6.4
6.4
7.3
9.6
29.5
22.5
1.3
1.0
27.5
30.5
2.0
1.4
MEP Infra
Neutral
101
-
1,646
2,403
2,910
18.3
16.8
2.4
6.1
43.1
16.7
16.3
11.0
35.2
55.8
1.8
1.5
SIPL
Neutral
96
-
3,373
2,060
2,390
46.8
47.7
(5.8)
(3.1)
3.6
4.1
(14.2)
(2.3)
6.4
6.0
Engineers India
Neutral
147
-
9,936
1,795
2,611
21.1
22.4
5.9
8.1
25.0
18.2
1.8
1.7
12.9
16.1
3.9
2.5
Financials
Axis Bank
Buy
501
580
120,155
32,558
35,843
3.5
3.2
27.8
41.0
18.0
12.2
2.0
1.7
11.4
14.9
-
-
Bank of Baroda
Neutral
140
-
32,143
22,533
26,079
2.4
2.4
12.0
20.9
11.6
6.7
0.8
0.7
6.6
11.0
-
-
Canara Bank
Neutral
310
-
18,513
17,925
20,235
2.0
2.1
18.5
36.5
16.8
8.5
0.6
0.6
3.4
6.2
-
-
Can Fin Homes
Neutral
2,617
-
6,966
586
741
3.5
3.5
107.8
141.0
24.3
18.6
5.3
4.3
24.1
25.6
-
-
Cholamandalam Inv. &
Accumulate
1,093
1,230
17,078
2,826
3,307
6.3
6.3
53.7
64.6
20.4
16.9
3.5
3.0
18.3
18.9
-
-
Fin. Co.
Dewan Housing Finance Accumulate
558
610
17,499
2,676
3,383
2.4
2.7
37.4
49.7
14.9
11.2
2.0
1.7
13.8
16.2
-
-
Equitas Holdings
Buy
152
235
5,155
1,125
1,380
9.6
9.8
1.5
6.0
101.4
25.4
2.3
2.1
2.4
8.2
-
-
Federal Bank
Accumulate
114
125
22,246
4,896
5,930
2.8
3.1
5.4
7.6
21.3
15.1
1.8
1.7
8.5
11.0
-
-
Stock Watch
October 06, 2017
Company Name
Reco
CMP
Target
Mkt Cap
Sales ( Čcr )
OPM(%)
EPS (Č)
PER(x)
P/BV(x)
RoE(%)
EV/Sales(x)
(Č)
Price ( Č)
( Č cr )
FY18E FY19E
FY18E
FY19E
FY18E
FY19E
FY18E
FY19E
FY18E
FY19E
FY18E
FY19E
FY18E
FY19E
Financials
GIC Housing
Buy
510
655
2,746
376
477
3.6
3.7
33.0
40.0
15.5
12.8
2.8
2.3
20.0
23.0
-
-
HDFC Bank
Neutral
1,799
-
464,509
55,236
63,253
4.5
4.4
68.9
82.4
26.1
21.8
4.6
3.8
18.7
18.5
-
-
ICICI Bank
Buy
272
315
174,359
42,361
51,378
3.6
3.9
18.4
25.7
14.8
10.6
1.6
1.6
11.3
15.0
-
-
Karur Vysya Bank
Buy
143
180
8,666
3,289
3,630
3.7
3.9
10.8
14.1
13.2
10.2
1.6
1.4
12.5
14.7
-
-
LIC Housing Finance
Neutral
648
-
32,725
4,895
6,332
3.4
3.7
50.7
66.8
12.8
9.7
2.6
2.1
21.7
23.8
-
-
Punjab Natl.Bank
Neutral
132
-
28,164
23,708
25,758
2.1
2.1
5.9
16.4
22.5
8.1
0.7
0.6
3.0
8.3
-
-
RBL Bank
Neutral
513
-
21,179
2,309
2,888
2.6
2.5
16.4
19.1
31.3
26.9
3.9
3.5
13.3
13.8
-
-
Repco Home Finance
Buy
642
825
4,018
496
597
4.4
4.2
38.5
48.7
16.7
13.2
3.0
2.5
19.6
20.6
-
-
South Ind.Bank
Neutral
30
-
5,368
3,195
3,567
3.0
3.1
3.0
3.8
9.9
7.8
1.0
0.9
10.5
11.9
-
-
St Bk of India
Neutral
251
-
216,967
105,827
121,056
2.4
2.5
16.1
25.6
15.6
9.8
1.2
1.1
6.6
9.9
-
-
Union Bank
Neutral
126
-
9,146
14,650
16,225
2.3
2.3
23.1
32.5
5.5
3.9
0.4
0.4
7.1
9.2
-
-
Yes Bank
Neutral
359
-
82,296
11,088
13,138
3.0
2.9
84.0
99.3
4.3
3.6
0.7
0.6
16.3
16.8
-
-
FMCG
Akzo Nobel India
Neutral
1,870
-
8,970
3,164
3,607
13.8
13.7
58.6
67.9
31.9
27.5
7.8
6.9
24.5
25.1
2.7
2.3
Asian Paints
Neutral
1,152
-
110,528
17,603
20,615
18.6
18.6
2,128.9
2,543.3
0.5
0.5
11.4
9.6
28.0
28.9
6.1
5.1
Britannia
Neutral
4,360
-
52,349
9,690
11,278
14.8
15.4
84.0
101.0
51.9
43.2
18.9
15.0
40.6
39.0
5.4
4.6
Colgate
Neutral
1,088
-
29,599
4,420
5,074
24.9
25.3
28.6
32.8
38.1
33.2
15.0
12.1
43.8
40.5
6.4
5.6
Dabur India
Neutral
317
-
55,787
8,346
9,344
19.6
19.9
7.8
9.0
40.6
35.2
8.2
7.4
25.2
24.8
6.3
5.5
GlaxoSmith Con*
Neutral
4,990
-
20,984
5,072
5,760
18.2
18.4
176.3
199.2
28.3
25.1
6.0
5.4
21.2
21.7
3.5
3.0
Godrej Consumer
Neutral
961
-
65,455
10,171
11,682
20.8
21.5
21.7
27.1
44.3
35.5
10.0
8.6
22.3
23.4
6.6
5.7
HUL
Neutral
1,188
-
257,151
37,077
41,508
20.3
21.8
5,189.9
6,318.5
0.2
0.2
36.2
30.9
74.8
82.0
6.8
6.1
ITC
Neutral
266
-
323,448
44,588
49,853
37.0
37.3
9.6
11.0
27.7
24.1
6.8
6.5
25.1
27.3
6.7
6.0
Marico
Neutral
313
-
40,385
6,788
7,766
18.5
19.2
7.1
8.5
44.1
36.8
15.4
13.2
36.9
38.0
5.8
5.0
Nestle*
Neutral
7,257
-
69,969
10,083
11,182
20.0
20.9
119.7
141.3
60.6
51.4
213.7
195.3
36.7
39.8
6.6
5.9
Tata Global
Neutral
209
-
13,219
7,121
7,641
11.9
12.3
6.9
8.0
30.4
26.2
2.0
1.9
6.8
7.2
1.7
1.5
Procter & Gamble
Neutral
8,551
-
27,758
3,034
3,579
27.1
27.7
167.7
198.8
51.0
43.0
13.7
11.8
28.8
29.5
8.6
7.2
Hygiene
IT
HCL Tech^
Accumulate
891
1,014
127,195
52,342
57,053
20.9
20.9
62.8
67.6
14.2
13.2
3.2
2.7
22.4
20.6
2.1
1.8
Infosys
Buy
903
1,179
207,439
73,963
80,619
26.0
26.0
64.4
69.3
14.0
13.0
2.8
2.6
19.7
19.6
2.2
2.0
TCS
Accumulate
2,430
2,651
478,844
127,403
138,870
27.6
27.6
144.5
156.0
16.8
15.6
5.0
4.7
29.7
29.8
3.4
3.1
Tech Mahindra
Buy
451
533
43,974
31,015
33,496
15.0
15.0
35.6
38.1
12.7
11.8
2.2
2.0
17.0
16.3
1.2
1.0
Stock Watch
October 06, 2017
Company Name
Reco
CMP
Target
Mkt Cap
Sales ( Čcr )
OPM(%)
EPS (Č)
PER(x)
P/BV(x)
RoE(%)
EV/Sales(x)
(Č)
Price ( Č)
( Č cr )
FY18E FY19E
FY18E
FY19E
FY18E
FY19E
FY18E
FY19E
FY18E
FY19E
FY18E
FY19E
FY18E
FY19E
IT
Wipro
Neutral
284
-
138,068
58,536
61,858
20.3
20.3
18.2
19.1
15.6
14.9
2.4
2.1
14.6
13.4
2.3
2.2
Media
D B Corp
Neutral
379
-
6,975
2,404
2,625
30.5
31.5
23.7
26.9
16.0
14.1
3.8
3.2
23.5
22.8
2.7
2.5
HT Media
Neutral
97
-
2,259
2,589
2,830
15.1
15.4
8.3
10.9
11.7
8.9
0.9
0.9
8.4
10.4
0.4
0.3
Jagran Prakashan
Buy
177
225
5,791
2,541
2,835
28.5
28.7
12.7
14.1
14.0
12.6
2.9
2.5
21.3
21.4
2.1
1.8
Sun TV Network
Neutral
781
-
30,774
3,238
3,789
51.9
55.1
30.9
38.0
25.3
20.6
7.2
6.3
30.0
31.0
9.0
7.6
Hindustan Media
Neutral
248
-
1,820
1,002
1,074
23.3
23.5
29.2
33.8
8.5
7.3
1.3
1.1
15.6
15.4
0.8
0.6
Ventures
TV Today Network
Buy
364
435
2,169
667
727
27.7
27.7
18.6
20.1
19.6
18.1
3.0
3.1
15.6
17.3
2.8
2.6
Music Broadcast Limited Accumulate
382
434
2,177
271
317
91.0
109.0
6.0
10.0
63.6
38.2
4.0
3.6
6.5
9.3
7.6
6.3
Metals & Mining
Coal India
Neutral
273
-
169,462
82,301
91,235
17.0
18.0
17.1
20.5
16.0
13.3
3.0
2.8
45.0
55.0
1.7
1.5
Hind. Zinc
Neutral
313
-
132,083
22,108
24,555
57.0
58.0
22.1
26.3
14.1
11.9
4.6
3.7
32.0
35.0
5.0
4.2
Hindalco
Neutral
241
-
54,037
102,350
105,355
13.5
14.5
21.5
24.5
11.2
9.8
1.5
1.3
15.0
15.2
1.1
1.1
JSW Steel
Neutral
249
-
60,189
64,500
68,245
21.1
21.5
20.1
21.2
12.4
11.8
2.3
1.9
-
-
1.7
1.6
NMDC
Neutral
119
-
37,729
10,209
11,450
47.0
48.0
11.1
12.1
10.7
9.9
1.5
1.4
-
-
3.2
2.9
SAIL
Neutral
54
-
22,344
54,100
63,555
3.0
10.0
(10.0)
1.5
36.1
0.7
0.7
-
-
1.4
1.2
Vedanta
Neutral
318
-
118,355
81,206
87,345
28.0
29.0
26.5
33.5
12.0
9.5
2.7
2.3
-
-
2.2
1.9
Tata Steel
Neutral
660
-
64,120
121,445
126,500
16.2
17.2
65.4
81.3
10.1
8.1
1.6
1.4
-
-
1.1
0.9
Oil & Gas
GAIL
Neutral
431
-
72,878
53,115
52,344
14.2
15.3
30.0
31.1
14.4
13.9
1.8
1.7
-
-
1.1
1.1
ONGC
Neutral
171
-
219,384
83,111
84,934
44.2
44.9
16.4
16.9
10.4
10.1
1.3
1.2
-
-
2.5
2.5
Indian Oil Corp
Neutral
406
-
197,077
396,116
432,560
8.5
8.8
40.1
42.2
10.1
9.6
1.8
1.6
-
-
0.6
0.6
Reliance Industries
Neutral
824
-
536,043
257,711
267,438
17.0
18.2
89.1
89.5
9.3
9.2
0.9
0.8
-
-
1.7
1.7
Pharmaceuticals
Alembic Pharma
Buy
503
600
9,485
3,903
4,584
18.2
19.2
21.8
27.2
23.1
18.5
4.2
3.5
19.8
20.6
2.5
2.1
Alkem Laboratories Ltd
Accumulate
1,832
2,079
21,901
6,320
7,341
17.5
19.8
72.7
96.6
25.2
19.0
4.5
3.8
16.7
18.7
3.4
2.9
Aurobindo Pharma
Accumulate
742
823
43,484
17,086
19,478
22.1
22.0
44.7
51.4
16.6
14.4
3.7
3.0
24.7
22.7
2.7
2.3
Aventis*
Neutral
4,063
-
9,358
2,508
2,862
16.8
16.8
139.9
153.8
29.0
26.4
4.2
3.4
23.5
25.8
3.3
2.7
Cadila Healthcare
Reduce
501
426
51,264
11,584
13,228
20.3
20.4
18.7
21.3
26.8
23.5
6.0
4.9
24.6
22.9
4.2
3.7
Cipla
Sell
585
458
47,070
16,619
19,437
15.4
16.2
19.7
24.3
29.7
24.1
3.4
3.0
12.0
13.2
3.0
2.5
Dr Reddy's
Neutral
2,387
-
39,581
15,844
17,973
17.6
18.2
91.7
111.0
26.0
21.5
3.0
2.7
11.9
13.0
2.7
2.4
GSK Pharma*
Neutral
2,437
-
20,645
3,260
3,651
15.0
18.0
46.1
58.6
52.9
41.6
10.9
11.2
20.0
26.5
6.2
5.7
Indoco Remedies
Sell
213
153
1,966
1,154
1,310
14.9
14.9
11.3
12.7
18.9
16.8
2.7
2.4
15.0
15.0
1.8
1.6
Stock Watch
October 06, 2017
Company Name
Reco
CMP
Target
Mkt Cap
Sales ( Čcr )
OPM(%)
EPS (Č)
PER(x)
P/BV(x)
RoE(%)
EV/Sales(x)
(Č)
Price ( Č)
( Č cr )
FY18E FY19E
FY18E
FY19E
FY18E
FY19E
FY18E
FY19E
FY18E
FY19E
FY18E
FY19E
FY18E
FY19E
Pharmaceuticals
Ipca labs
Neutral
528
-
6,659
3,593
4,022
14.5
15.5
19.4
25.2
27.2
20.9
2.5
2.2
9.5
11.2
1.9
1.7
Lupin
Buy
1,028
1,467
46,442
18,657
21,289
21.3
23.3
52.8
66.7
19.5
15.4
2.9
2.5
16.3
17.5
2.5
2.1
Natco Pharma
Accumulate
982
1,057
17,121
1,886
2,016
32.3
29.5
23.2
22.0
42.4
44.6
8.9
7.9
20.9
17.6
8.9
8.3
Sun Pharma
Accumulate
514
558
123,321
32,899
36,451
26.9
25.4
31.6
32.3
16.3
15.9
2.9
2.5
18.7
18.8
3.4
2.9
Syngene International
Buy
483
557
9,651
1,402
1,823
32.8
36.0
15.9
20.7
30.4
23.4
5.7
4.7
18.7
20.0
6.9
5.3
Power
Tata Power
Neutral
79
-
21,354
32,547
33,806
20.5
20.5
4.7
5.4
16.8
14.8
1.6
1.4
10.5
10.5
1.6
1.6
NTPC
Neutral
171
-
140,833
86,070
101,246
28.3
30.7
12.9
16.2
13.2
10.5
1.4
1.3
10.6
12.4
3.0
2.7
Power Grid
Accumulate
205
223
107,169
29,183
32,946
89.7
90.0
18.0
20.8
11.4
9.9
1.9
1.7
17.7
18.2
7.6
7.1
Real Estate
Prestige Estate
Neutral
279
-
10,448
4,607
5,146
21.0
22.2
7.9
9.8
35.3
28.4
2.2
2.0
10.3
12.0
3.4
3.1
MLIFE
Accumulate
469
522
2,409
487
590
12.3
17.8
21.0
31.2
22.4
15.1
1.2
1.1
5.2
7.4
3.7
3.0
Telecom
Bharti Airtel
Neutral
378
-
151,002
97,903
105,233
36.0
36.3
9.3
11.1
40.6
34.2
2.0
1.9
5.0
5.6
2.5
2.2
Idea Cellular
Neutral
74
-
26,583
35,012
37,689
27.1
27.7
(4.4)
(2.7)
1.2
1.2
(6.8)
(4.6)
2.1
1.9
zOthers
Abbott India
Neutral
4,139
-
8,795
3,244
3,723
14.9
16.1
167.5
209.4
24.7
19.8
5.5
4.6
23.7
24.8
2.4
2.0
Asian Granito
Buy
473
570
1,422
1,169
1,286
12.5
12.5
16.0
19.7
29.6
24.0
3.2
2.8
10.7
11.6
1.5
1.3
Bajaj Electricals
Accumulate
366
395
3,719
4,646
5,301
6.7
7.6
16.1
22.3
22.8
16.4
3.7
3.2
16.4
19.2
0.8
0.7
Banco Products (India)
Neutral
209
-
1,495
1,530
1,695
13.2
12.7
19.0
20.0
11.0
10.5
1.8
1.6
0.2
0.2
0.9
98.4
Coffee Day Enterprises
Neutral
215
-
4,419
3,494
3,913
17.4
18.0
4.8
5.7
-
37.6
1.9
1.8
-
0.1
1.7
1.5
Ltd
Elecon Engineering
Neutral
60
-
675
171
201
15.0
16.2
36.0
43.0
1.7
1.4
0.1
0.1
0.1
0.1
3.3
2.8
Garware Wall Ropes
Neutral
902
-
1,974
928
1,003
15.2
15.2
39.4
43.2
22.9
20.9
3.8
3.2
16.5
15.4
2.0
1.8
Goodyear India*
Neutral
803
-
1,852
1,717
1,866
11.8
12.3
47.9
49.8
16.8
16.1
2.6
2.2
15.6
15.7
0.8
110.7
Hitachi
Neutral
1,980
-
5,384
2,355
2,715
10.3
10.8
49.0
60.9
40.4
32.5
9.5
7.5
0.2
0.2
2.3
2.0
HSIL
Neutral
391
-
2,825
2,240
2,670
14.6
15.0
17.0
22.0
23.0
17.8
1.9
1.8
0.1
0.1
1.5
1.2
Interglobe Aviation
Neutral
1,100
-
39,787
22,570
27,955
14.2
15.0
63.6
81.8
17.3
13.5
9.1
7.7
0.5
0.6
1.4
1.1
Jyothy Laboratories
Neutral
396
-
7,202
1,781
2,044
14.1
15.0
9.4
10.5
42.4
37.8
9.0
8.5
0.2
0.2
4.3
3.6
Linc Pen & Plastics
Neutral
242
-
358
420
462
9.3
9.3
15.3
17.1
15.8
14.1
2.7
2.8
16.9
19.5
0.9
0.8
M M Forgings
Neutral
689
-
831
542
642
20.1
21.0
41.6
56.8
16.6
12.1
2.3
1.9
0.1
0.2
1.9
1.7
Mirza International
Neutral
164
-
1,977
1,148
1,285
18.0
18.0
8.0
9.4
20.4
17.6
3.4
2.9
16.3
16.1
1.9
1.6
Navkar Corporation
Buy
185
265
2,633
561
617
41.5
41.5
11.5
12.7
16.0
14.5
1.7
1.5
10.5
10.4
5.4
4.7
Nilkamal
Neutral
1,565
-
2,336
2,317
2,525
11.4
11.1
96.0
105.0
16.3
14.9
2.8
2.4
0.2
0.2
1.0
0.9
Stock Watch
October 06, 2017
Company Name
Reco
CMP
Target Mkt Cap
Sales ( Čcr )
OPM(%)
EPS (Č)
PER(x)
P/BV(x)
RoE(%)
EV/Sales(x)
(Č)
Price ( Č)
( Č cr )
FY18E FY19E FY18E FY19E FY18E FY19E FY18E FY19E FY18E FY19E FY18E FY19E FY18E FY19E
zOthers
Parag Milk Foods
Neutral
262
-
2,200
1,987
2,379
7.6
9.0
12.4
18.3
21.1
14.3
3.0
2.6
8.2
13.2
1.2
1.0
Radico Khaitan
Neutral
172
-
2,292
1,811
1,992
13.2
13.2
8.1
8.8
21.3
19.6
2.1
2.3
10.1
12.0
1.6
1.4
Relaxo Footwears
Neutral
518
-
6,217
1,981
2,310
13.7
14.5
12.0
15.5
43.1
33.4
8.4
6.8
0.2
0.2
3.2
2.7
Siyaram Silk Mills
Accumulate
2,345
2,500
2,198
1,769
1,981
12.7
12.7
113.1
131.1
20.7
17.9
3.2
2.8
15.5
15.5
1.4
1.3
Styrolution ABS India* Neutral
1,001
-
1,760
1,800
1,980
8.0
8.1
42.0
46.2
23.8
21.7
2.7
2.4
0.1
0.1
1.1
1.0
Surya Roshni
Neutral
303
-
1,328
4,870
5,320
7.7
7.8
22.8
28.1
13.3
10.8
1.8
1.5
0.1
0.1
0.5
0.4
TVS Srichakra
Neutral
2,988
-
2,288
2,729
2,893
12.7
12.5
248.5
265.0
12.0
11.3
3.4
2.8
0.3
0.3
0.8
0.8
Visaka Industries
Neutral
677
-
1,076
1,104
1,214
12.1
12.6
31.0
37.9
21.9
17.9
2.7
2.4
0.1
0.1
1.2
1.1
VIP Industries
Buy
256
300
3,619
1,450
1,693
10.4
10.5
6.5
7.8
39.1
32.8
8.3
7.2
21.1
22.1
2.5
2.1
Navin Fluorine
Neutral
748
-
3,687
945
1,154
22.4
22.6
28.7
34.8
26.1
21.5
4.3
3.7
-
-
3.4
2.7
Source: Company, Angel Research; Note: *December year end; #September year end; &October year end; Price as on October 05, 2017
Market Outlook
October 06, 2017
Research Team Tel: 022 - 39357800
DISCLAIMER
Angel Broking Private Limited (hereinafter referred to as “Angel”) is a registered Member of National Stock Exchange of India
Limited,Bombay Stock Exchange Limited and Metropolitan Stock Exchange Limited. It is also registered as a Depository Participant with
CDSL and Portfolio Manager with SEBI. It also has registration with AMFI as a Mutual Fund Distributor. Angel Broking Private Limited is a
registered entity with SEBI for Research Analyst in terms of SEBI (Research Analyst) Regulations, 2014 vide registration number
INH000000164. Angel or its associates has not been debarred/ suspended by SEBI or any other regulatory authority for accessing
/dealing in securities Market. Angel or its associates/analyst has not received any compensation / managed or
co-managed public offering of securities of the company covered by Analyst during the past twelve months.
This document is solely for the personal information of the recipient, and must not be singularly used as the basis of any investment
decision. Nothing in this document should be construed as investment or financial advice. Each recipient of this document should make
such investigations as they deem necessary to arrive at an independent evaluation of an investment in the securities of the companies
referred to in this document (including the merits and risks involved), and should consult their own advisors to determine the merits and
risks of such an investment.
Reports based on technical and derivative analysis center on studying charts of a stock's price movement, outstanding positions and
trading volume, as opposed to focusing on a company's fundamentals and, as such, may not match with a report on a company's
fundamentals. Investors are advised to refer the Fundamental and Technical Research Reports available on our website to evaluate the
contrary view, if any.
The information in this document has been printed on the basis of publicly available information, internal data and other reliable
sources believed to be true, but we do not represent that it is accurate or complete and it should not be relied on as such, as this
document is for general guidance only. Angel Broking Pvt. Limited or any of its affiliates/ group companies shall not be in any way
responsible for any loss or damage that may arise to any person from any inadvertent error in the information contained in this report.
Angel Broking Pvt. Limited has not independently verified all the information contained within this document. Accordingly, we cannot
testify, nor make any representation or warranty, express or implied, to the accuracy, contents or data contained within this document.
While Angel Broking Pvt. Limited endeavors to update on a reasonable basis the information discussed in this material, there may be
regulatory, compliance, or other reasons that prevent us from doing so.
This document is being supplied to you solely for your information, and its contents, information or data may not be reproduced,
redistributed or passed on, directly or indirectly.
Neither Angel Broking Pvt. Limited, nor its directors, employees or affiliates shall be liable for any loss or damage that may arise from
or in connection with the use of this information.